Context and pHenotype Aware ReguLatory sIgnatures Extraction (CHARLIE)
CHARLIE is designed to uncover unbiased, context-specific gene expression signatures and cell signaling subnetworks that regulate experimentally observed features such as cell shapes and inflammation. Unlike traditional methods that focus on known pathways, CHARLIE constructs phenotype-specific signaling networks from feature-correlated gene expression modules and their upstream regulators.
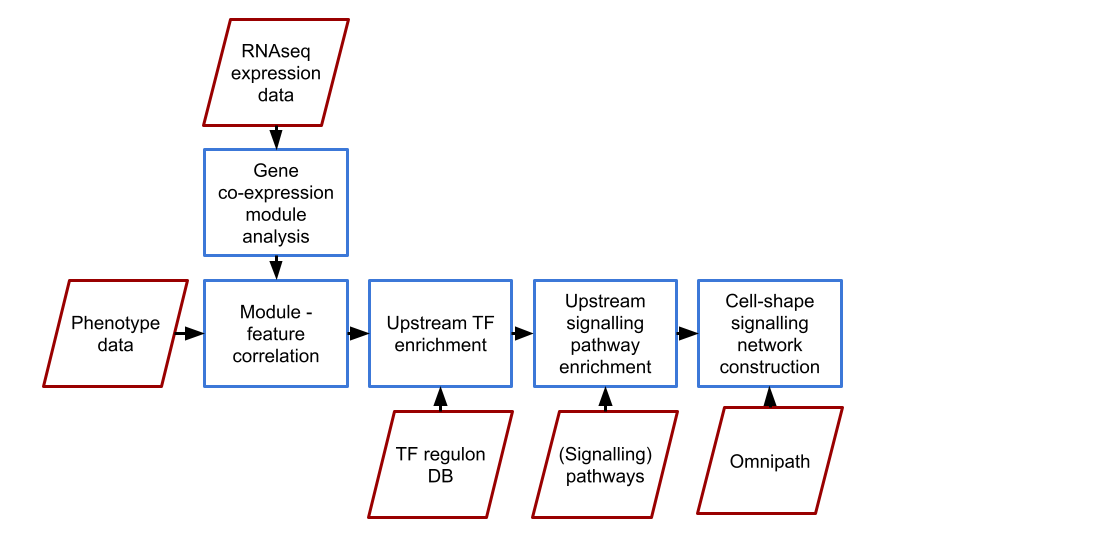

The process involves:
- Identify gene expression modules from RNA-seq data using weighted gene co-expression network analysis (WGCNA).
- Correlate these gene expression modules with selected features to find (morphologically) relevant modules.
- Identify transcription factors (TFs) whose targets significantly overlap with the expression modules.
- Find pathways that regulate the gene expression modules using these TFs.
- Integrate these pathways to form a contiguous (signaling) network using the Prize-Collecting Steiner Forest (PCSF) algorithm.
If you find CHARLIE useful, please cite:
BD Maier, T Koutsandreas, CG Barker, E Petsalaki. CHARLIE: A Web server for Context and pHenotype Aware ReguLatory sIgnatures Extraction. 2024, in preparation.
CG Barker, E Petsalaki, G Giudice, J Sero, EN Ekpenyong, C Bakal, E Petsalaki E. Identification of phenotype-specific networks from paired gene expression-cell shape imaging data. 2022, Genome Research, 23 Feb 2022, 32(4):750-765. https://doi.org/10.1101/gr.276059.121
Software and License
CHARLIE is developed and maintained by the Petsalaki Group (EMBL-EBI) and distributed under the Apache License, Version 2.0. All code for running this workflow, a scaleable NextFlow Pipeline as well as a Docker image of the web server can be found on Gitlab .
Omics Data Upload
.png)
1.) Browse the tabular (transcript-)omics file. Rows should represent gene names and columns should denote sample names/ids.
2.) Alternatively, you can load the example data from Barker et al., 2022 (Genome Research). All settings for this file will be automatically set, but you can change all the settings to see their effects.
3.) Use the Header checkbox to indicate if your file contains a header row.
4.) Column separators are automatically detected based on the file format. You can manually adjust the separator using the Separator dropdown menu.
5.) Select the decimal separator ( . or , ) using the Decimal Separator dropdown menu.
After uploading your file or loading the example file, the full menu will show up:
6.) Select the organism used for gene id conversion and TF regulons and enrichment databases. Currently, we can process human, mouse and rat data given the availability of regulons.
7/7b.) Select the column with the gene name identifier(s).
8.) Assign the gene identifier column to their respective type: gene symbol, ensembl, uniprot, other. This information is used to convert gene identifiers internally for the different enrichment and regulon retrieval tasks.
9.) Select which gene types should be excluded from the analysis. You can download a list of the genes associated with each category from the download section, and it’s also available in our GitHub repository.
10.) If you have additional metadata columns or samples which you do not want to include in the analysis, you can deselect them after file upload.
.png)
Features Data Upload
.png)
1.) Browse the tabular feature file. Rows should represent sample names/ids and columns should denote features. After upload, you can select which column represents the sample names/ids. All other columns should contain numerical values only. You can deselect any additional metadata columns or unwanted features after the upload. If the sample names/id match the ones from the omics data file, there is no need to match samples between files, otherwise you will be asked to assign them manually using (multi) drag-and-drop. Different measurements of the same sample (e.g. multiple FOVs) can either be merged or treated as individual values for the downstream analysis.
2.) Alternatively, you can load the example data from Barker et al., 2022 (Genome Research). All settings for this file will be automatically set, but you can change all the settings to see their effects.
3.) Use the Header checkbox to indicate if your file contains a header row.
4.) Column separators are automatically detected based on the file format. You can manually adjust the separator using the Separator dropdown menu.
5.) Select the decimal separator ( . or , ) using the Decimal Separator dropdown menu.
After uploading your file or loading the example file, the full menu will show up:
6.) Select the column with the sample name/identifier.
7.) For the subsequent analysis, the omics data will be correlated to the omics data. If the column names of the omics file correspond to the rownames of the feature file, the assignment is done automatically and no reassignment is needed. Otherwise, the checkbox is automatically selected and the features must be assigned manually.
8. & 9.) If multiple feature measurements (e.g. different FOVs) correspond to the same omics sample, the feature values can be combined using either mean or median (8). By selecting a condition column (9), all rows having the same condition will be grouped together and combined.
10. & 11.) Sample names/ids from the feature file are automatically assigned to the sample names/ids from the omics file. Sample names/ids from the feature file which are not matching any of the omics names/ids (10), have to be manually assigned by selecting them and moving (drag-and-drop) them to the right omics name/id box (e.g. 11). It is possible to select multiple sample names/ids by clicking on all of them before dragging them together.
12.) If you have additional metadata columns or features which you do not want to include in the analysis, you can deselect them after file upload.
13.) Features can be scaled using min-max normalization or standardized using z-score normalization. Z-scores is the preferred method in the presence of outliers. Histograms of the feature distributions for each feature can be generated in the 'Visualisation' tab, which allows you to (de-)select the distribution of all samples individually.
.png)
Weighted gene co-expression network analysis (WGCNA)
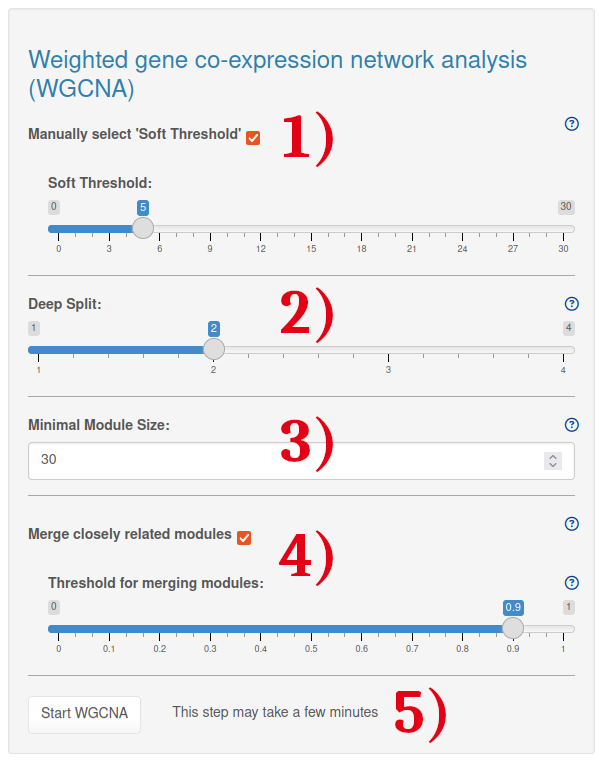
1.) By default, the soft threshold is automatically picked using the pickSoftThreshold function, which calculates for each power if the network resembles to a scale-free graph. The appropriate soft-thresholding power is set to the lowest power for which the scale free topology fit (R^2) exceeds 0.85 (default WGCNA package option). Alternatively, you can manually select the soft threshold power. In this case, we still recommend starting with the automatic pickSoftThreshold function. Based on the resulting plot, you can then adjust the soft threshold as needed.
2.) The deepSplit provides a simplified control over how sensitive module detection should be to module splitting. The value decides where the hierarchical tree is cut to define the gene modules. Low deepSplit values yield few clusters with many genes, while high values yield many clusters with less genes.
3.) The minimal module size determines the minimal number of genes to be included in a module.
4.) Modules whose eigengenes are highly correlated can be merged based on a selected threshold. This is achieved by clustering module eigengenes using the dissimilarity given by one minus their correlation, cutting the dendrogram at the height mergeCutHeight and merging all modules on each branch. The process is iterated until no modules are merged.
5.) After choosing the WGCNA settings, the analysis can be started by clicking on the 'Start WGCNA' button. This will yield the soft threshold power estimation plot, the hierachical tree as well as all gene modules. Please note that this step may take a few minutes.
Module Feature Correlation
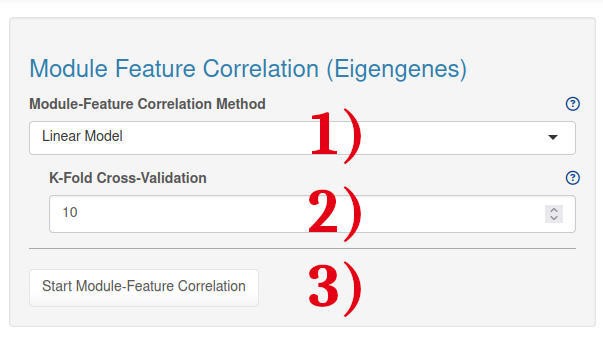
1.) Select the module-feature correlation method. We recommend using the linear model, however it is also possible to run a simple correlation model with a user-defined correlation threshold.
2.) Select the k-fold cross-validation value for the linear regression model. Every “k-fold” method uses models trained on in-fold observations to predict the response for out-of-fold observations.
3.) After choosing the analysis settings, the analysis can be started by clicking on the 'Start Module-Feature Correlation' button.
Upstream Transcription Factor Enrichment
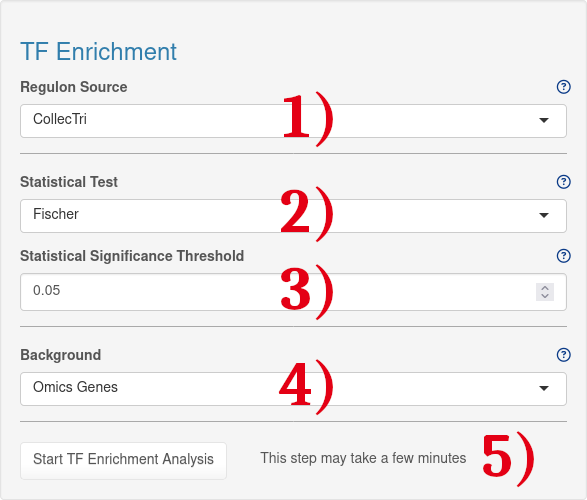
1.) Transcription factor - gene interaction database used for TF enrichment analysis. For academic use, CollecTRI should be used (Mueller-Dott et al., 2023) . It is an expansion of DoRothEA (Garcia-Alonso et al., 2019. For non-academic use, DoRothEA (non-acad.) should be selected
2.) Statistical test which is performed to see which Transcription Factors are significantly enriched.
3.) Treshold for statistical significance test.
4.) List of background genes used for TF enrichment analysis. By default, all genes included in the omics file are used.
5.) After choosing the enrichment analysis settings, the analysis can be started by clicking the 'Start TF Enrichment' button.
Upstream Signalling Pathway Enrichment
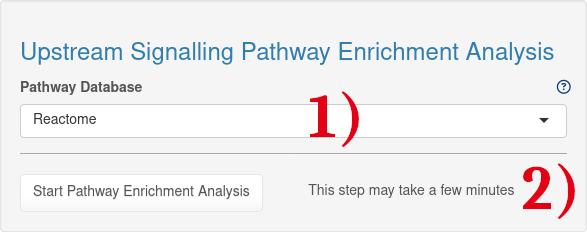
1.) Signalling pathway database used for upstream signalling pathway enrichment analysis. By default, a manually curated subset of Reactome is used with all signalling pathways.
2.) After selecting the pathway database, the pathway enrichment analysis can be started by clicking on the 'Start Pathway Enrichment' button.
Context-specific Network Construction
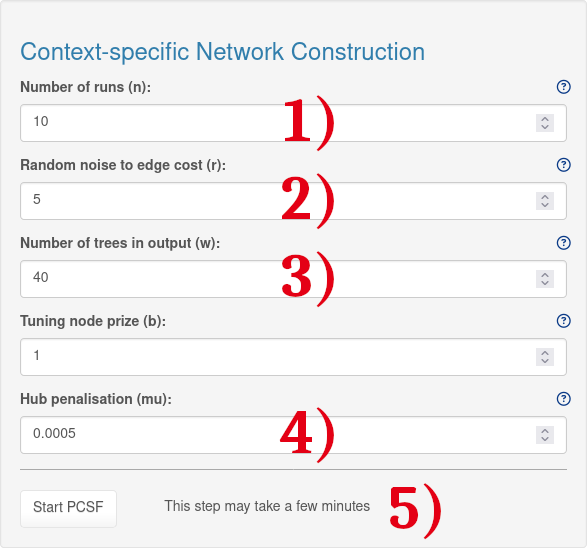
1.) An integer value to determine the number of runs with random noise added edge costs. A default value is 10.
2.) A numeric value to determine additional random noise to edge costs. A random noise up to r percent of the edge cost is added to each edge. A default value is 0.1
3.) A numeric value for tuning the number of trees in the output. A default value is 1.
4.) To prevent hub nodes in PPI networks from disproportionately appearing in PCSF solutions, the PCSF package employs a hub penalisation method described in Tuncbag et al. (2013). This method penalizes the prizes of nodes based on their degree in the PPI.
5.) After choosing the PCSF settings, the analysis can be started by clicking on the 'Start PCSF' button. This will yield a continous signalling network. Please note that this step may take a few minutes.
Reference Page
Citation
If you find Context and pHenotype Aware ReguLatory sIgnatures Extraction (CHARLIE) useful and use it for your project please cite:
Method: Barker CG, Petsalaki E, Giudice G, Sero J, Ekpenyong EN, Bakal C, Petsalaki E. Identification of phenotype-specific networks from paired gene expression-cell shape imaging data. Genome Research. 2022 Apr;32(4):750-765. https://doi.org/10.1101/gr.276059.121
Webserver: Maier BD, Koutsandreas T, Barker CG, Petsalaki E. CHARLIE: A Web server for Context and pHenotype Aware ReguLatory sIgnatures Extraction. (in preparation)
Code Availability
All code for running this workflow, a scaleable NextFlow Pipeline as well as a Docker image of the web server can be found at:
https://gitlab.ebi.ac.uk/petsalakilab/charlie_webserver
Contact:
For questions and suggestions, please open a GitHub issue or email Benjamin Maier (bmaier [at] ebi [dot] ac [dot] uk).
License:
Copyright 2024 Petsalaki Group | EMBL's European Bioinformatics Institute (EMBL-EBI)

Licensed under the Apache License, Version 2.0 (the 'License');
you may not use this file except in compliance with the License.
You may obtain a copy of the License at

    http://www.apache.org/licenses/LICENSE-2.0

Unless required by applicable law or agreed to in writing, software
distributed under the License is distributed on an 'AS IS' BASIS,
WITHOUT WARRANTIES OR CONDITIONS OF ANY KIND, either express or implied.
See the License for the specific language governing permissions and
limitations under the License.